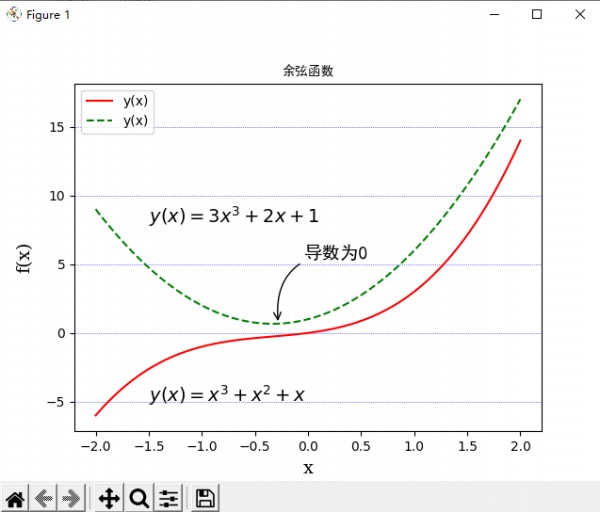
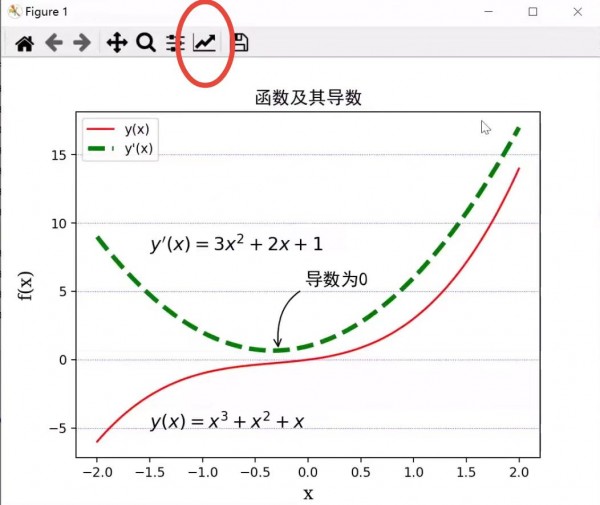
结果显示如第一幅图, 为什么没有第二幅图的按钮(figure options)呢?
import matplotlib.pyplot as plt
import numpy as np
x = np.linspace(-2, 2, 100)
y1 = x**3 + x**2 + x
y2 = 3*x**2 + 2*x + 1
fig, ax = plt.subplots()
ax.plot(x, y1, ls="-", color="red", lw=1.5, label = 'y(x)')
ax.plot(x, y2, ls="--", color="green", lw=1.5, label = 'y(x)')
plt.legend(loc=2,ncol=1)
ax.set_title('余弦函数',fontproperties = 'SimHei')
ax.text(-1.5,-5,'$y(x) = x^3 + x^2 + x$', fontsize = 14, family = 'serif')
ax.text(-1.5,8,'$y(x) = 3x^3 + 2x + 1$', fontsize = 14, family = 'serif')
ax.annotate('导数为0', fontsize = 14, fontproperties = 'SimHei', xy=(-0.28,0.67), xycoords = 'data', xytext = (+20, +50),
            textcoords='offset points', arrowprops = dict(arrowstyle = '->', connectionstyle = 'arc3, rad=.5'))
ax.set_xlabel('x', labelpad=5, fontsize = 14, family = 'serif')
ax.set_ylabel('f(x)', labelpad=10, fontsize = 14, family = 'serif')
ax.grid(color = 'blue', axis = 'y', linestyle = ':', linewidth=0.5)
plt.show()
我安装的是pycharm运行环境,是否和这个有关?